In this section
Planning for Zero Framework (PfZF)
The Planning for Zero Framework (PfZF) is Austroads’ overarching planning approach for jurisdictions committed to eliminating road deaths and serious injuries by 2050. It combines a systems-based application of the Safe System approach with long-term, backcasting-style planning and strengthened institutional management. The Framework supports road safety leaders, managers, and practitioners to define what a zero-trauma road transport system should look like, chart practical pathways to achieve it, and establish the organisational conditions required for successful implementation.
PfZF is built around two complementary dimensions:
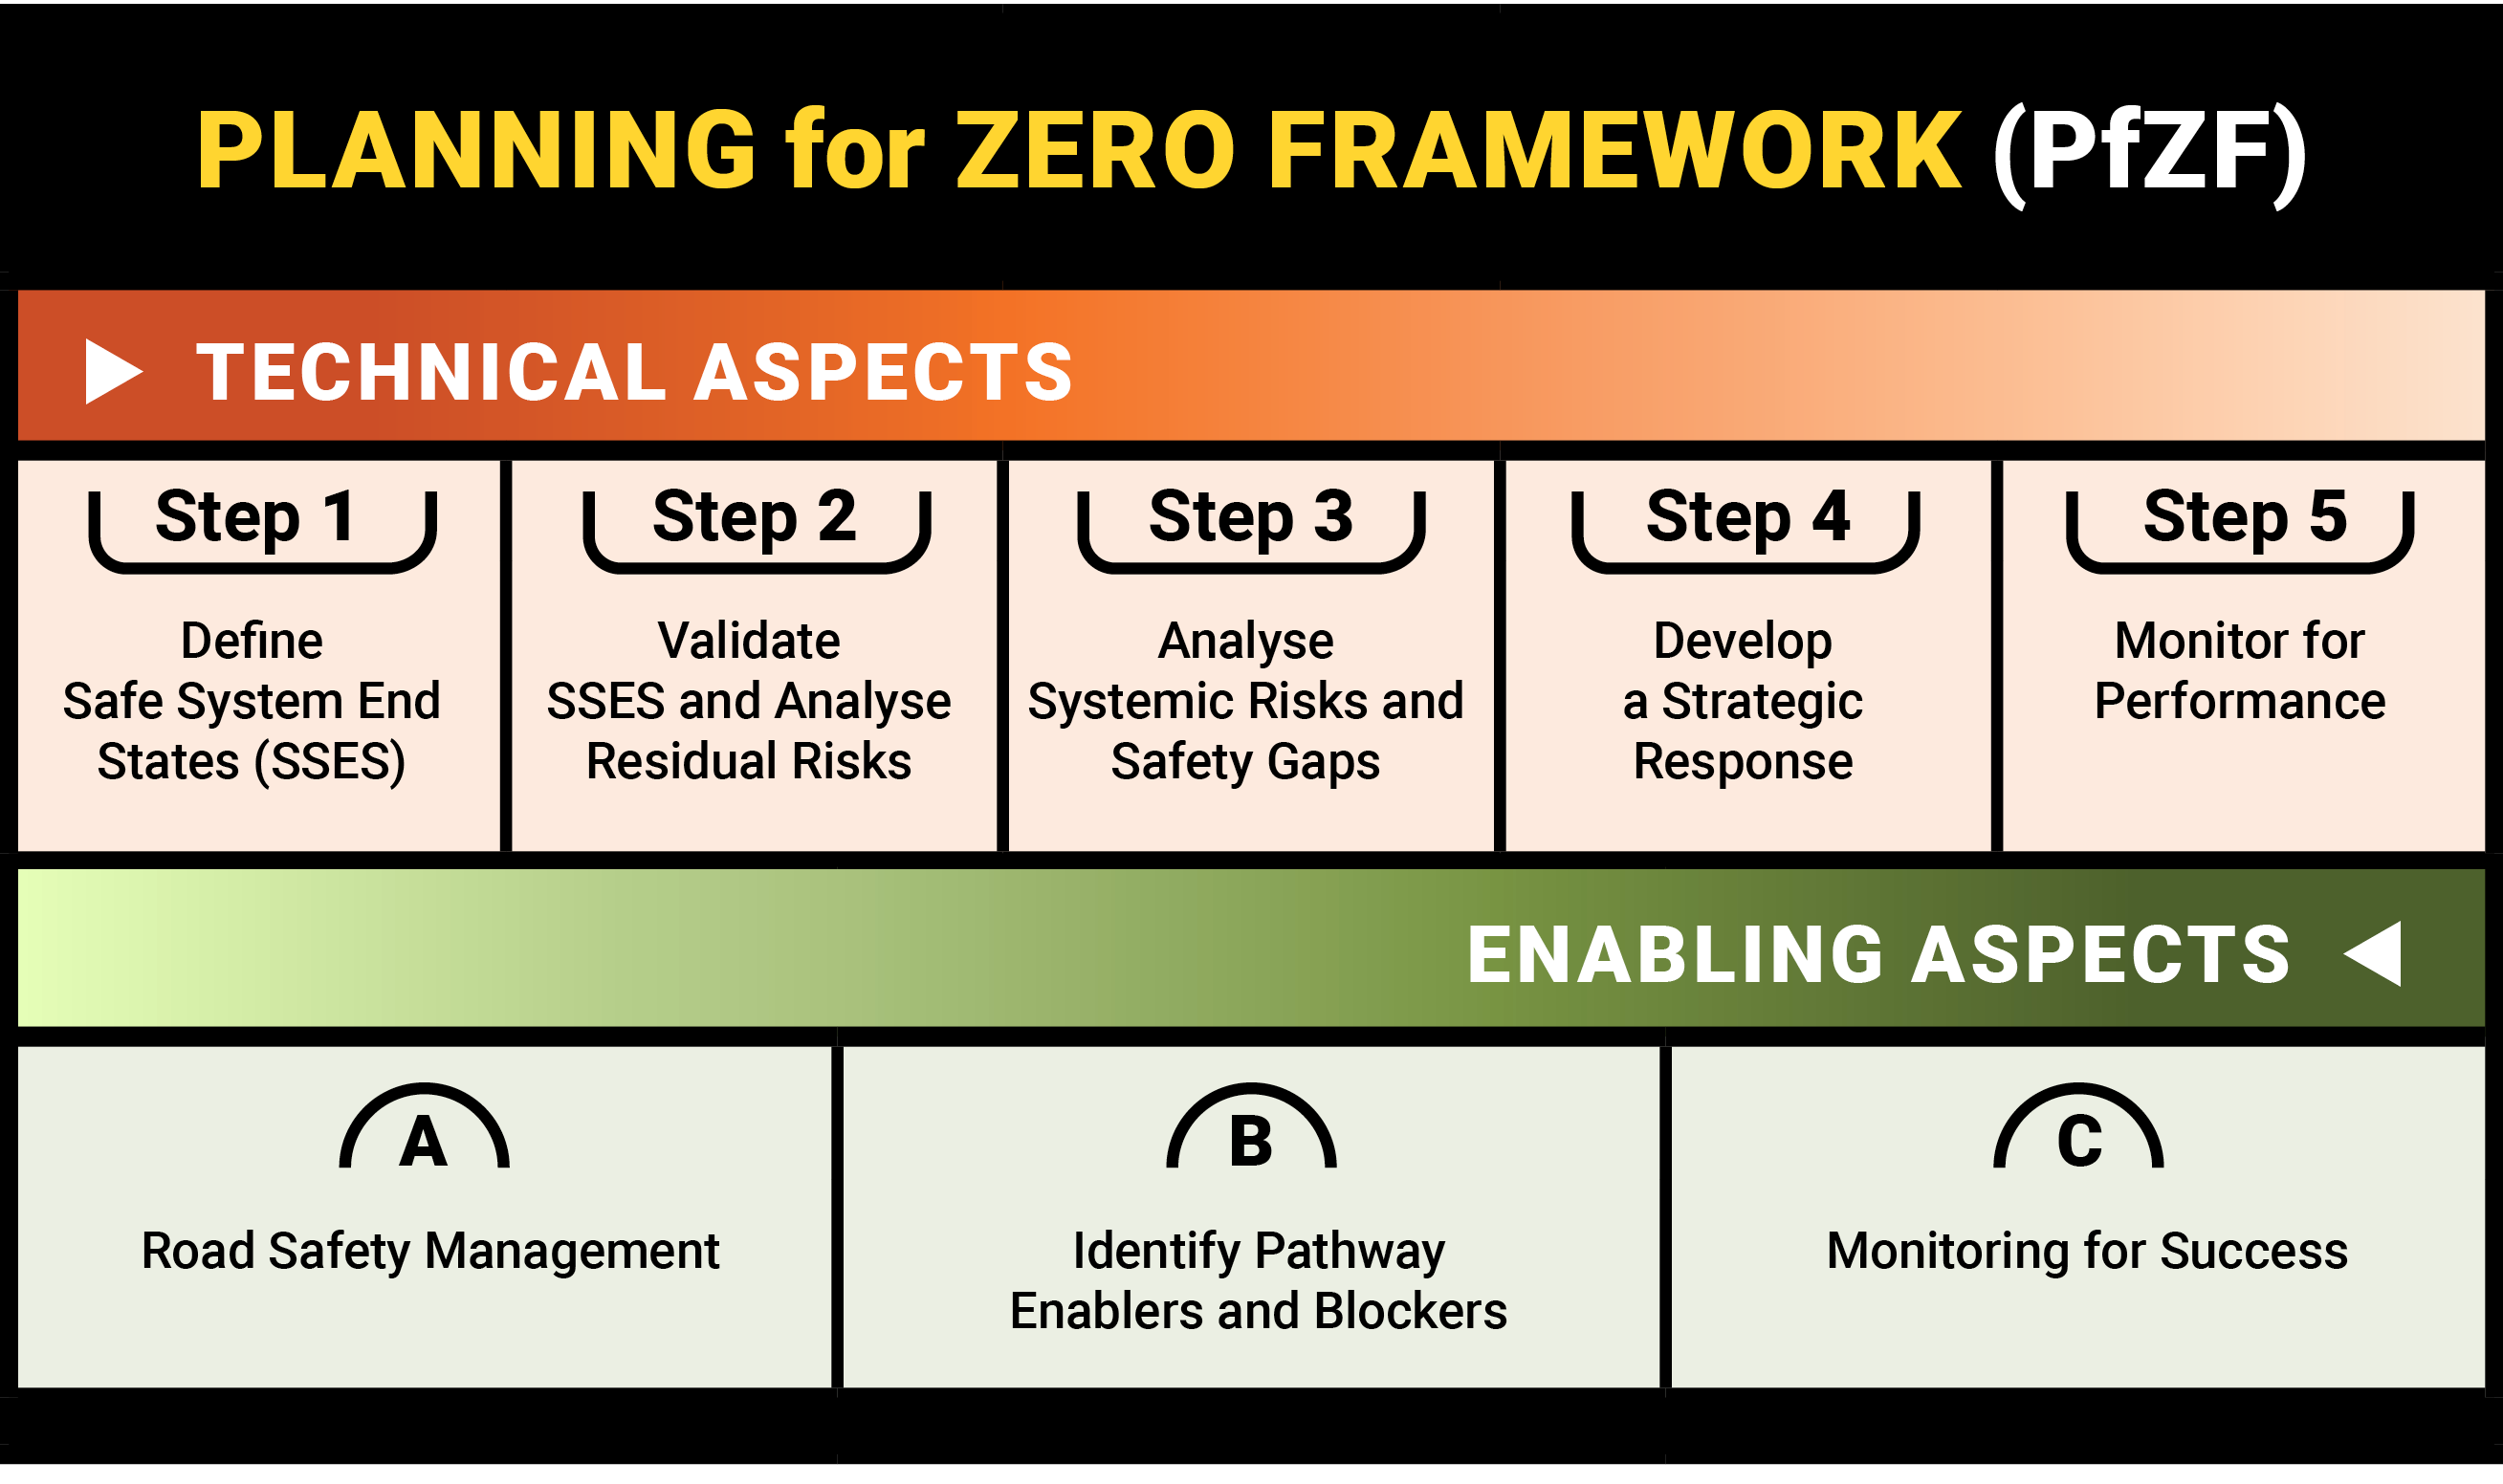
- Technical aspects: The analytical and planning steps used to define a Safe System End State (SSES), understand current and future risk, design pathways, and monitor performance. These technical aspects are delivered through the following five steps:
- Step 1: Define the desired future Safe System End State (SSES)
- Step 2: Conduct end-state validation and residual risk analysis
- Step 3: Conduct systemic risk and safety gap analysis
- Step 4: Develop strategic response and Pathways to Zero
- Step 5: Monitor performance.
- C: Monitoring for success.
- Enabling aspects: The management, capability and governance elements that allow jurisdictions to implement those pathways at scale, sustain progress and respond when things are off track. These enabling aspects are addressed through the following components:
- A: Road safety management
- B: Identify pathway enablers and blockers
Planning for Zero Framework - Technical Steps
Technical aspects – The five steps of the Planning for Zero Framework (PfZF)
Step 1 is the “define the vision” phase of the Planning for Zero Framework. Its purpose is to develop a technically defined Safe System End State (SSES) for each jurisdiction – that is, a description of what the road transport system must look like when zero harm is achieved. This involves four linked tasks:
- defining the concept of zero harm and the injury levels it covers
- setting a time-bound zero target (e.g. zero death and serious injury by 2050)
- situating the work within the jurisdiction’s overarching transport and land-use planning framework
- specifying SSES designs for all road users and all parts of the network, based on human biomechanical tolerance and other critical system elements such as vehicles and speed management.
In practice, Step 1 translates Safe System principles into concrete design requirements for different Movement and Place contexts (e.g. vehicle-priority corridors, mixed-traffic streets, and pedestrian-priority areas). For each context and road-user group, the SSES defines the combination of infrastructure features, vehicle technologies, and maximum travel/impact speeds needed to ensure that foreseeable crashes do not exceed agreed injury thresholds.
Figure 1.1 Safe System End States –Key system elements
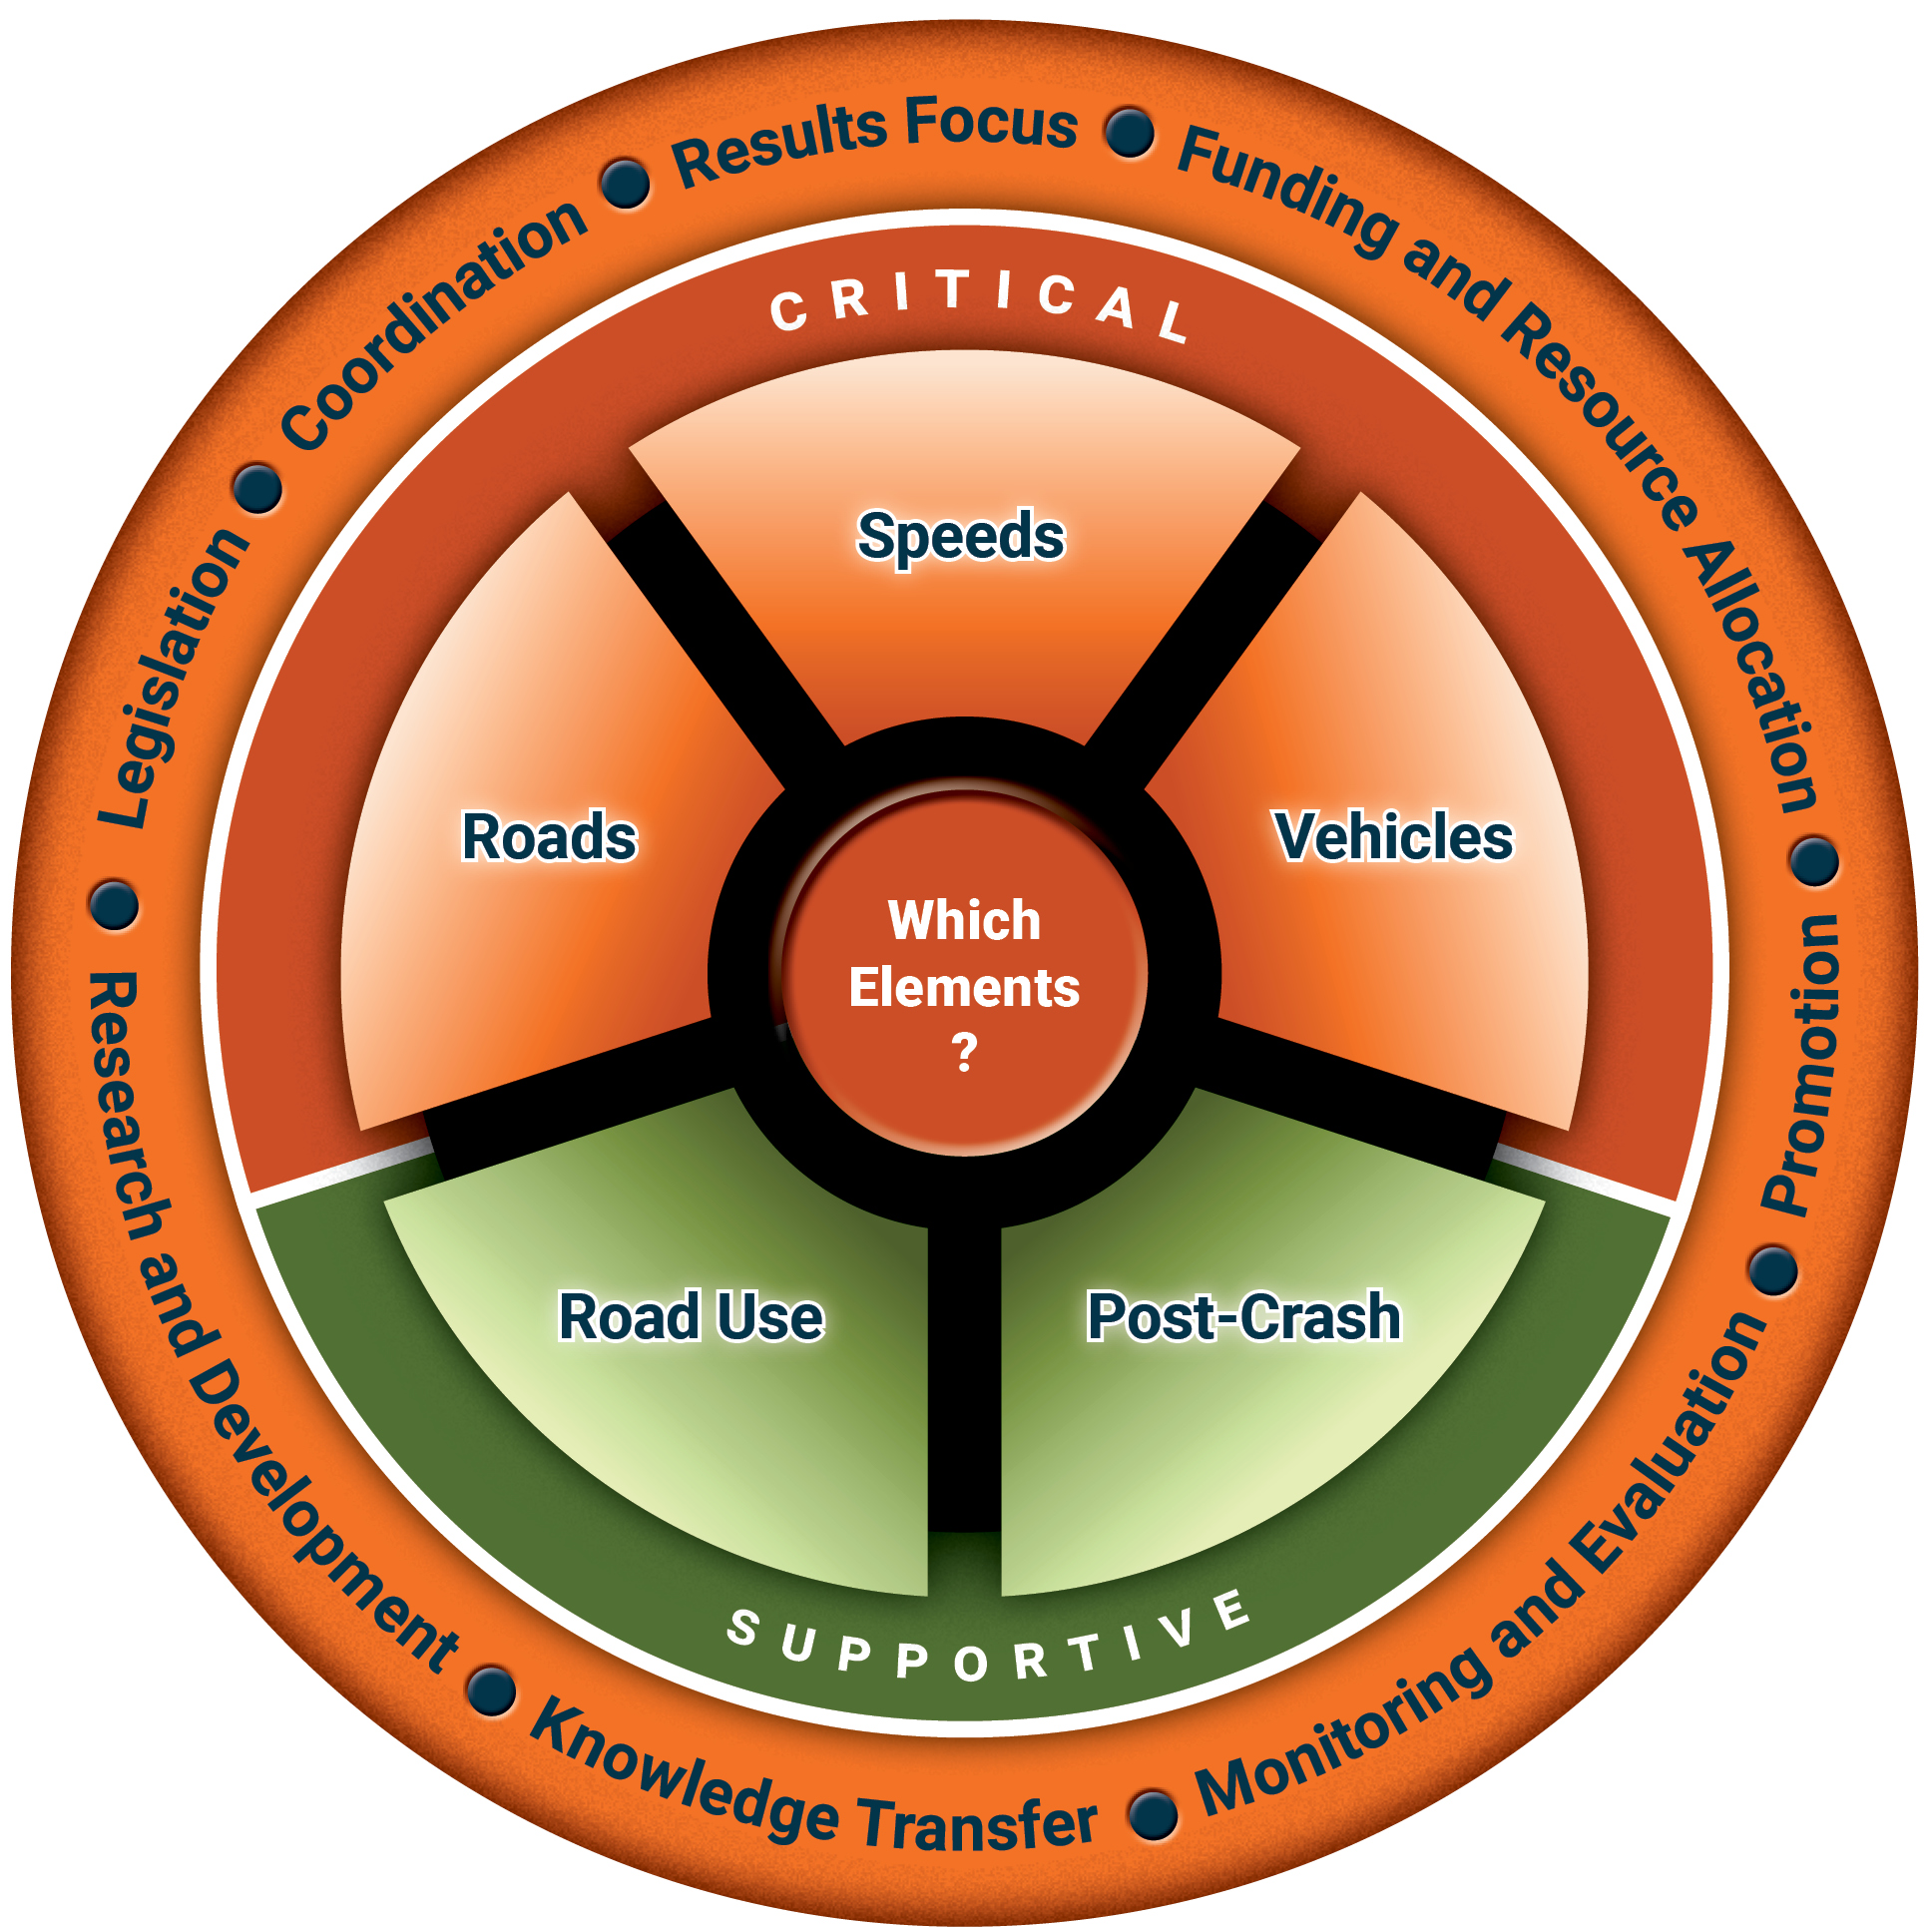
Example SSES specifications – including separate “Ultimate” (2050) and “Interim” (e.g. 2030) states – are illustrated in some publicly available references such as Truong et al. (2022).
Table 1.1 Ultimate Safe System in 2050 for Pedestrian Priority Areas (adopted from Truong et al., 2022)
| Vehicles Requirements | Vehicles Requirements | Maximum Travel Speed Requirements | |
|---|---|---|---|
| Vehicle free zone | N/A | Off road seperated lanes not in pedestrian areas for bicycles and micro-mobility devices. | N/A |
| Vehicles allowed No motorcycles |
| Off road seperated lanes not in pedestrian areas for bicycles and micro-mobility devices. | 10 km/h |
Source: Truong, J., Strandroth, J., Logan, D. B., Job, R. S., & Newstead, S. (2022). Utilising human crash tolerance to design an interim and ultimate safe system for road safety. Sustainability, 14(6), 3491.
The technical foundation for Step 1 is human biomechanical tolerance and the associated injury-risk curves. Using evidence on the delta-v and impact speeds that correspond, for example, to a 10% risk of serious injury (MAIS2+), the framework identifies safe impact-speed thresholds for key crash types (head-on, side-impact, pedestrian, cyclist, motorcycle, run-off-road, etc.). It then works backwards to determine the infrastructure, vehicle, and speed-management requirements needed to keep crash forces within those limits.
In defining an “Ultimate” SSES, the preference is to rely on non-reliant-on-human-input/compliance (NRHIC) measures wherever possible (e.g., ISA limiting, physical separation, forgiving roadsides, and automated emergency braking), using human-reliant measures only where no effective NRHIC option exists.
The outcome of Step 1 is therefore a clear, jurisdiction-specific picture of what a zero-harm system must provide across the network – a technical end-state that later steps can validate, compare with today’s system, and use to design pathways to zero.
Step 2 tests whether the proposed Safe System End State (SSES) is technically capable of delivering (near) zero harm and, just as importantly, clarifies what types of crashes and serious trauma would remain even if the SSES were fully implemented. It does this by validating the SSES against real-world crash data and analysing the “residual risk” – the fatalities and serious injuries not prevented by the SSES.
In practice, jurisdictions apply the SSES conditions (e.g. infrastructure features, speed limits, and vehicle technologies) to historic fatal and serious-injury crashes using counterfactual, case-by-case analysis (also referred to in some jurisdictions as in-depth serious trauma modelling). For each crash, analysts assess whether the outcome would still have been fatal or serious under the SSES. This allows jurisdictions to:
- quantify the share of current trauma that could be prevented with existing Safe System interventions
- estimate the proportion and nature of crashes that remain in the residual.
Leading applications suggest that a well-specified SSES could prevent around 90% of deaths and 60–80% of serious injuries using interventions that are already available.
The next step is to understand why crashes remain in the residual. Drawing on experience from Sweden, Victoria, New South Wales and New Zealand, typical explanations include:
- crashes involving vulnerable road users in high-speed environments
- crashes occurring outside the effective envelope or boundary conditions of vehicle and infrastructure technologies (e.g. speeds above AEB activation thresholds, missing line-marking for LKA, poor friction, darkness)
- non-conformities where an intervention should have worked but did not in a specific case (e.g. tampered SBR, misuse of restraints)
- implementation-time effects, where effective treatments exist but are not yet deployed widely enough or fleet renewal is incomplete
- situations where no suitable intervention currently exists, pointing to genuine innovation gaps.
Case-by-case serious trauma analysis can be used to estimate the proportion of fatalities and serious injuries prevented by the SSES, while a breakdown (e.g. implementation time, no relevant intervention, outside the effective envelope) can be used to categorise the remaining cases. The outcome of Step 2 is a validated SSES and a structured description of residual risk that highlights priority areas for innovation and provides a critical bridge between end-state design (Step 1) and systemic risk and safety-gap analysis (Step 3).
Step 3 compares the current road transport system with the Safe System End State (SSES) to identify where and how serious trauma is caused today. It does this by analysing systemic risks (the major recurring crash types that drive deaths and serious injuries) and safety gaps (parts of the system where key Safe System attributes are missing). Together, these analyses show where the system is consistently operating outside human biomechanical tolerance and where large gains towards zero are possible.
Systemic risks are defined as major crash types that occur systematically across the network and account for more than 5% of all crashes within each relevant movement or road stereotype category. Examples include run-off-road (RoR) and head-on crashes on high-speed rural corridors, intersection crashes on urban arterials, and pedestrian or cyclist crashes in activity centres. These data are adopted from technical reports reviewed as part of the Charting a Path to Zero project.
Safety gaps are locations or network segments where roads and vehicles lack the significant safety attributes needed to address those systemic risks – essentially, places where the current system falls well short of SSES requirements (for example, high-speed undivided roads without median or roadside barriers, or busy urban streets without adequate separation and protection for people walking and cycling).
In practice, Step 3 typically involves:
- classifying the network into the same Movement and Place contexts / road stereotypes used in the SSES
- summarising current fatal and serious-injury crashes by crash type, road-user group and stereotype to identify systemic risks (using the ≥5% threshold or similar)
- assessing, for each stereotype, the extent of missing SSES attributes (e.g. proportion of length without barriers, number of high-risk intersections, extent of 50–60 km/h streets without safe active-mode facilities) to quantify safety gaps
- synthesising these findings into short lists and visualisations (maps, cross-section diagrams, summary tables) that highlight where systemic risks and large safety gaps coincide.
The outcome of Step 3 is a clear, evidence-based picture of where the system is farthest from the SSES and which crash types, road-user groups and network elements should be prioritised when developing strategic responses and Pathways to Zero in Step 4.
Step 4 turns the insights from the first three steps into a long-term strategic response – the Pathways to Zero. It is comparable to a jurisdiction’s road safety strategy and set of action plans, but with a critical difference: Pathways to Zero deliberately looks out to around 2050 and sets out how to transform the system so it converges on the SSES, rather than only seeking incremental improvements over the next 3–10 years.
The first task in Step 4 is to develop a baseline trend of future trauma under a business-as-usual scenario. This baseline incorporates existing and already-planned infrastructure programs, enforcement and behaviour-change initiatives, and expected improvements in vehicle safety due to fleet renewal and the introduction and uptake of new vehicle safety technology. Using appropriate modelling tools (for example, time-series models, aggregated trauma models and/or counterfactual case-by-case analyses), jurisdictions estimate the deaths and serious injuries that would occur out to 2050 if no additional measures beyond business-as-usual were implemented.
The next task is to analyse the gap between this baseline and the jurisdiction’s interim and 2050 zero-harm targets, including the characteristics of future residual trauma (by crash type, road-user group, road stereotype and geography). This understanding is then used to design additional interventions and investment programs – infrastructure, speed management, vehicle safety, enforcement, behaviour change and supporting capacity building actions – that can close the gap in both the short term (e.g. to 2030) and long term (to 2050).
Step 4 also introduces a different investment logic: while short-term action plans still need to be cost-effective and deliverable, they must also contribute to a long-term transformation of the network consistent with the SSES, even when this involves higher up-front capital costs for larger lifetime safety benefits.
The outcome of Step 4 is one or more Pathways to Zero scenarios: coherent, sequenced packages of interventions and supporting actions showing how trauma is expected to fall over time compared with the baseline, and how the network progressively moves towards the SSES. These pathway scenarios provide the bridge between analysis and delivery and form the basis for performance monitoring in Step 5.
Step 5 establishes the monitoring framework that will track whether a jurisdiction is delivering its Pathways to Zero and progressing towards the Safe System End State (SSES) and zero-harm targets. It translates the strategic responses from Step 4 into a structured set of indicators, targets and reporting arrangements so that decision-makers can see what is being delivered, how the system is changing, and whether deaths and serious injuries are reducing in line with expectations. The monitoring framework should be treated as a living document that is refined and improved throughout the implementation of the pathway.
At the core of Step 5 is a four-tier indicator structure:
- Social costs: The social costs of road trauma are the monetised value of all consequences of road crashes, including direct costs (medical treatment, rehabilitation, emergency services, property damage, legal expenses) and indirect or intangible costs (long-term productivity losses, pain and suffering, loss of quality of life). Positioned at the top of the results chain, social costs are derived from final-outcome data and quantify the broader economic and welfare burden borne by society.
- Final outcomes: Final outcomes are the observed human health results of unsafe conditions in the road-traffic system—namely the numbers (or rates) of fatalities, serious injuries and, where data are reliable, medically treated minor injuries. They are the ultimate measure of system failure or success and the key input for estimating social costs.
- Intermediate outcomes (or SPIs): Intermediate outcomes, or Safety Performance Indicators (SPIs), describe the operational conditions that causally influence crash risk or injury severity. They are system-level, intervention-neutral measures such as free-flow traffic speed distributions, proportion of drivers exceeding blood-alcohol limits, prevalence of pedestrian-detecting AEB in the vehicle fleet, or safety ratings of pedestrian crossings. Because SPIs typically move before final outcomes, they provide early warning and a finer diagnostic lens for policy adjustment.
- Outputs of road safety interventions (Key Performance Indicators, KPIs): Key Performance Indicators capture the scale, quality and timeliness of pedestrian-safety management actions, programmes and measure outputs. They include tangible deliverables (e.g. kilometres of raised crossings installed, percentage of urban streets re-signed to 30 km/h) and organisational effort metrics (e.g. proportion of approved pedestrian-safety budget committed by mid-year, number of multi-agency task-force meetings). KPIs show what the system is doing; taken alone, they do not indicate how safe the system currently is—that role belongs to SPIs.
Planning for Zero Framework – Enabling Steps
The three enabling aspects of the Planning for Zero Framework (PfZF)
Road safety management comprises a combination of functions, systems and processes designed to significantly reduce road deaths and serious injuries. It emphasises a continuous improvement approach and a focus on results, which drives the development, implementation and monitoring of effective injury prevention strategies. Effective road safety management practice can steer every element and setting of the road transport system within a professional’s or organisation’s remit towards safer outcomes and the achievement of road safety targets (e.g. a 50% reduction in deaths and serious injuries by 2030 and zero by 2050).
Road safety management systems comprise institutional management functions that produce interventions, which in turn produce results. A systematic review of the literature identified ten elements of road safety management practice:
- focus on outcomes and continuous improvement
- accountability and governance
- engagement, collaboration and organisational culture
- strengthening legislative frameworks
- principles, evidence and data-driven action
- risk assessment and mitigation
- sustained funding and resource allocation
- monitoring, evaluation and reporting
- understanding interactions and interdependencies
- Safe System implementation and integration.
In the PfZF, enablers and blockers are the institutional, cultural, and practical conditions that either support or hinder delivery of the agreed Pathways to Zero. They are not abstract concepts: each enabler or blocker is defined in relation to a specific intervention or package of interventions selected to close a particular safety gap and move the system towards the SSES.
For example, if the pathway includes large-scale speed limit reductions from 100 km/h to 80 km/h on rural arterials, community attitudes to speed, political support, legislation, funding arrangements, and delivery capacity for signing and enforcement all become potential enablers or blockers for that intervention. Identifying pathway enablers and blockers is therefore a targeted, intervention-by-intervention task rather than a generic checklist.
The Stream 1 work proposes a simple process that starts with the SSES requirement, quantifies the safety gap (e.g. 13,000 km of rural roads where speed and infrastructure do not match), specifies the scale and timing of the intervention (e.g. staged speed limit reductions to 2050), and then systematically documents the main blockers and enablers for implementation.
Typical blockers for speed management include opposition to speed limit changes, expectations of fast travel, and cultural preferences, while enablers include strong government policy and advocacy, strategic integration with wider transport and land-use plans, and the use of public-opinion research to build support.
The project’s broader review and workshops highlighted a consistent set of high-level blockers across jurisdictions. These include limited coordination across agencies, gaps or inconsistencies in legislation and standards, funding constraints, weak or fragmented promotion and advocacy, underdeveloped monitoring and evaluation systems, and insufficient investment in research, development, and knowledge transfer.
Local governments in particular face capacity and capability shortages, lack of strategic road-safety frameworks, and difficulties securing funding and political backing for Safe System–aligned projects; state and national governments struggle with similar funding and capability issues, plus community and political resistance to speed limit reductions and the practical challenges of re-designing and maintaining large networks.
Conversely, key enablers identified through the project include building Safe System skills and organisational capability (especially in local government); supporting councils to prepare Network Safety Plans (or equivalent fit-for-purpose network road-safety risk assessments and action plans); aligning PfZF pathways with existing strategic transport and land-use plans; securing stable funding and resourcing; strengthening advocacy and public communication around Safe System and Vision Zero; and embedding robust monitoring, evaluation, and feedback loops within governance structures.
Together, these enablers and blockers define the change-management task that jurisdictions must address alongside the technical work if they are to implement Pathways to Zero at the scale and pace required.
See the table in the next page.
As discussed under Step 5 of the Technical Aspects.
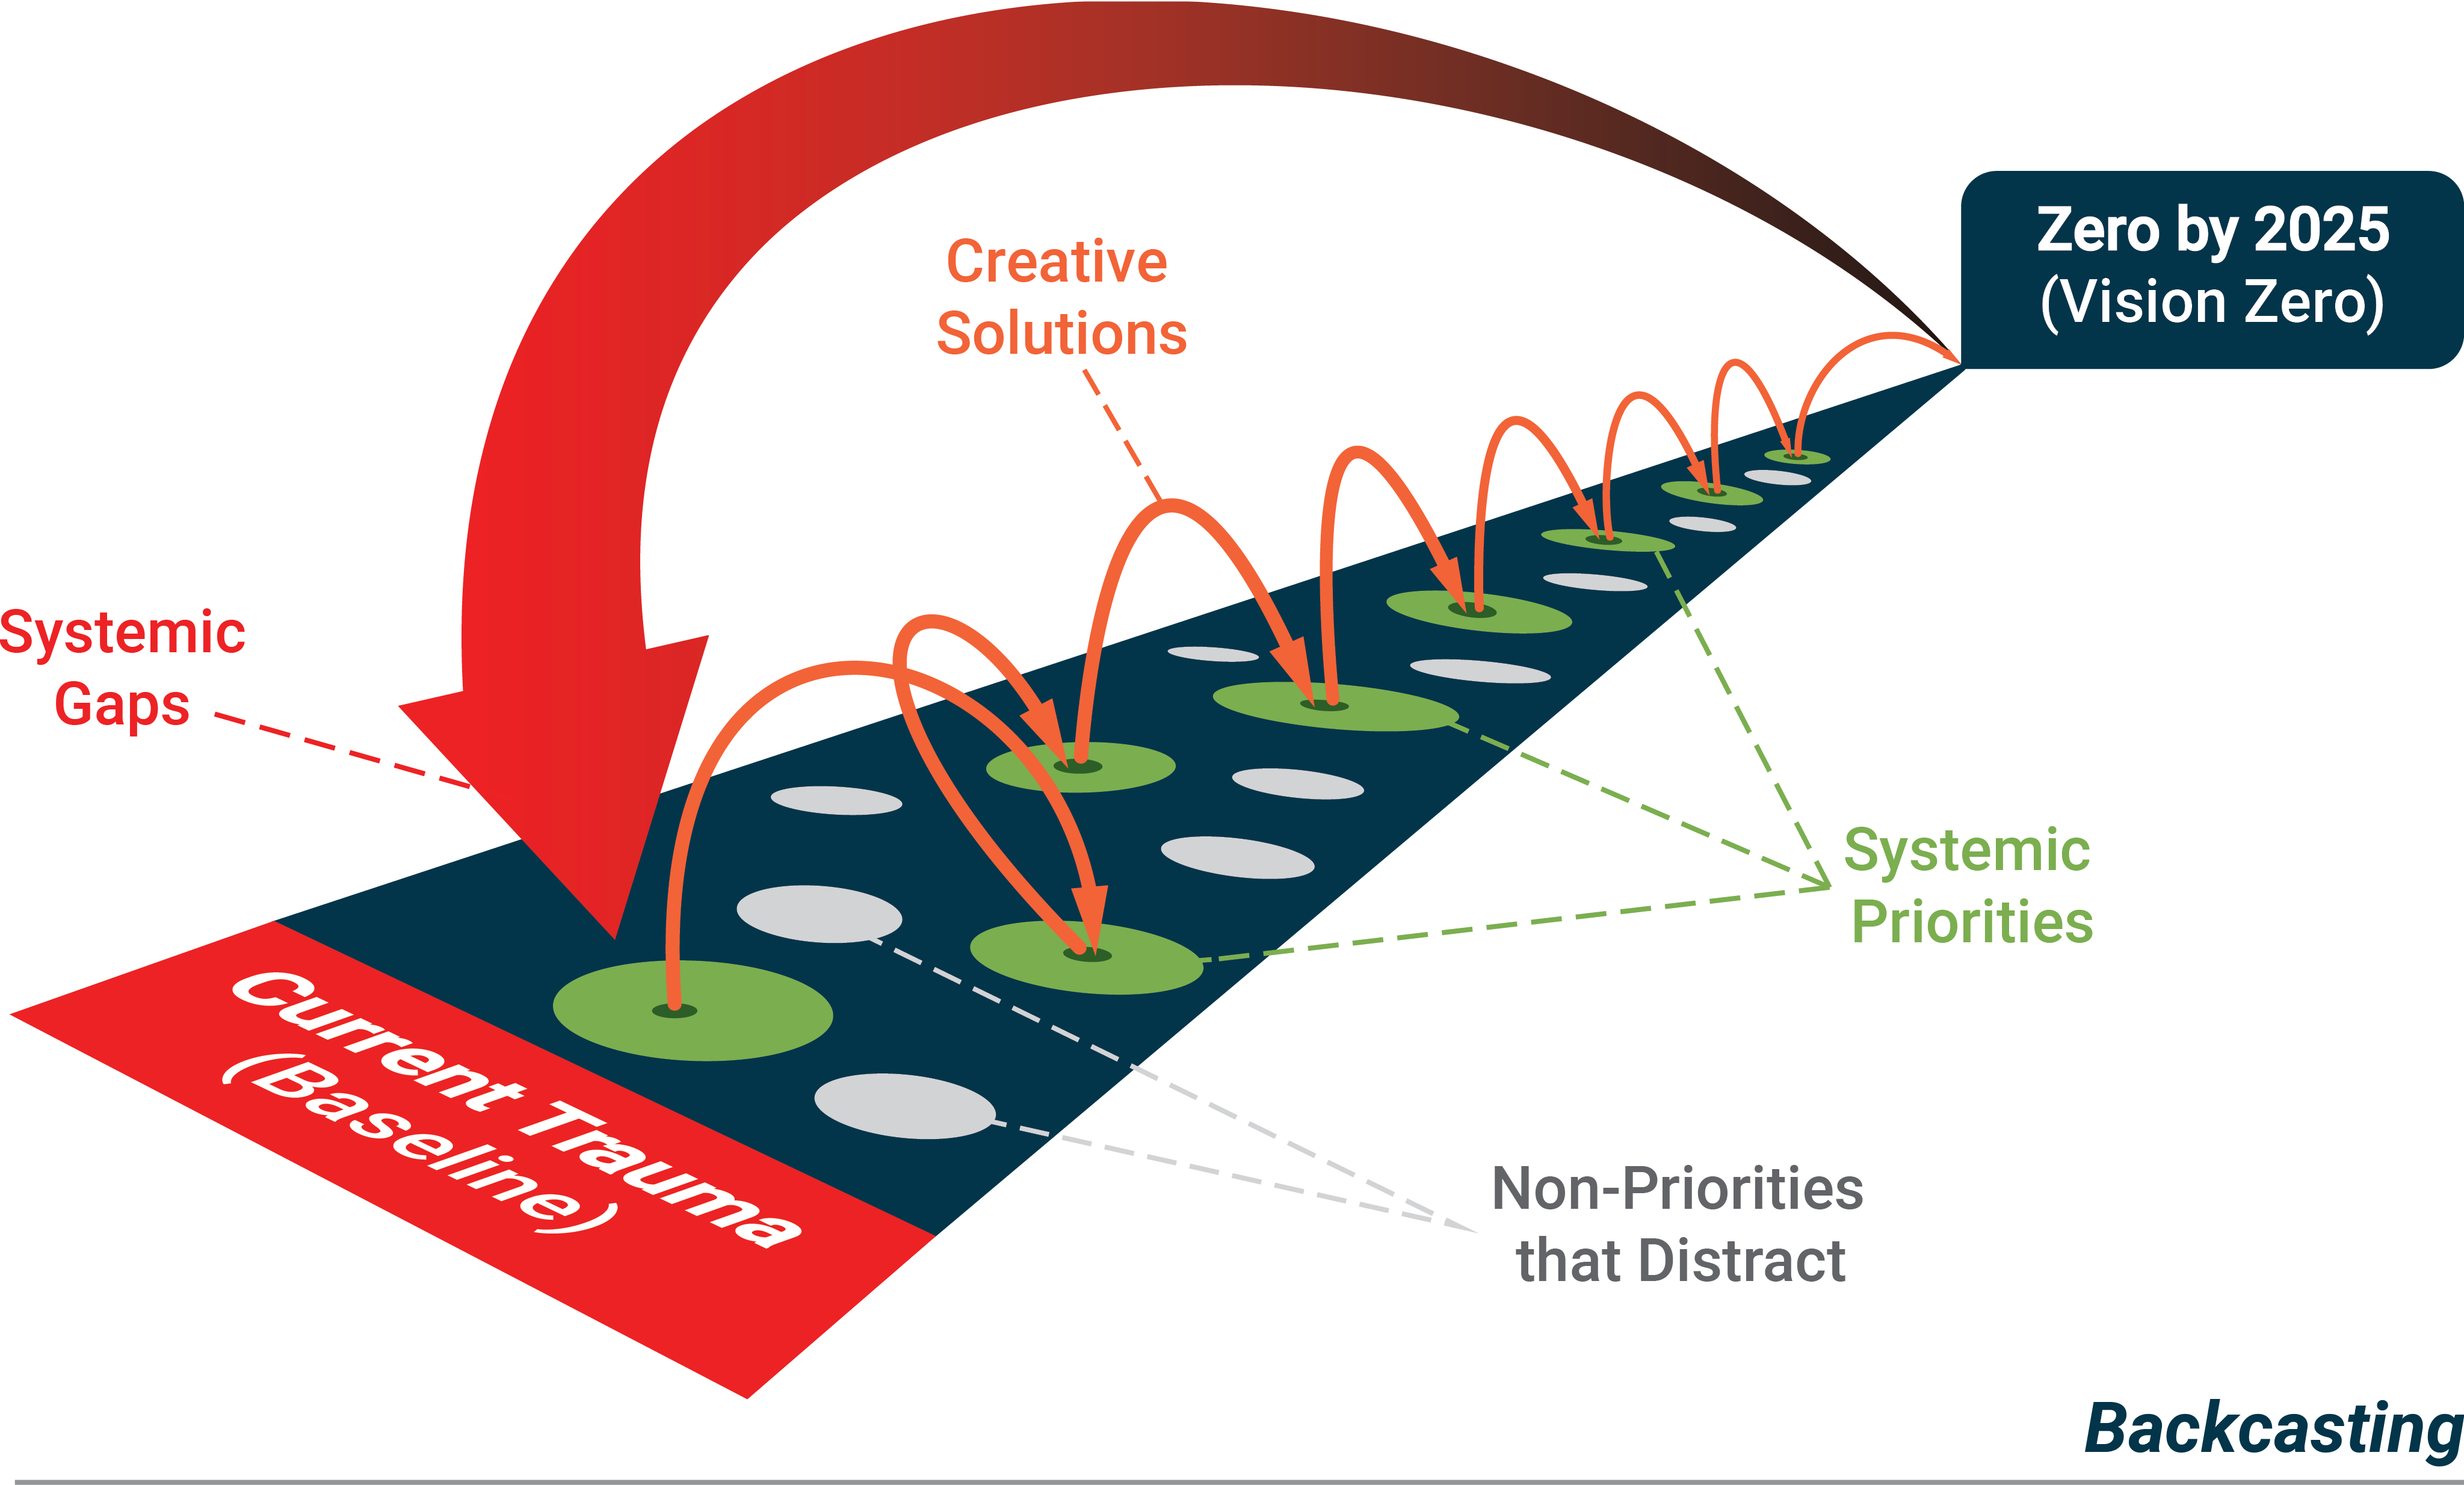
Planning for Zero Framework – Backcasting
Backcasting is a planning method that begins by specifying a clearly defined future road-safety outcome – such as zero deaths and serious injuries by 2050 – and then works backwards to determine what must change in the system to reach that outcome. Rather than extrapolating recent trends, it asks: “If we had a truly Safe System in 2050, what would vehicles, roads, speeds, and road-user outcomes need to look like – and what sequence of actions would get us from today to that state?”
Backcasting did not originate in road safety. It was first developed in the 1980s in energy and sustainability policy as a way to plan for desirable futures (for example, low-carbon energy systems) when simple forecasting could not credibly describe how to get there. Seminal work by Robinson described backcasting as the process of defining a normative future and then reasoning backwards to identify the policies and structural changes needed to achieve it.
In road safety, backcasting was taken up early by the Swedish Transport Administration in the development of Vision Zero. Sweden recognised that to move from casualty-reduction thinking to a Safe System, it was necessary to define what a safe road traffic model must look like (in terms of infrastructure, vehicles, behaviour, and speeds), and then use that model to guide long-term transformation and set safety performance indicators for monitoring progress.
In practical road safety work, backcasting combines two ingredients: a technically specified Safe System End State (SSES) and time-bound trauma targets. The SSES describes the combination of infrastructure, vehicle performance and maximum travel/impact speeds that keep crash forces within human biomechanical tolerance, while still delivering the required movement function of the network. Comparing this future SSES with today’s network and trauma patterns allows agencies to identify the gap between current performance and Safe System performance, and then to assemble programs and innovations that can close that gap over time.
Because it is anchored in the desired end state rather than recent history, backcasting is intrinsically transformational: it focuses on the structural changes needed to deliver zero harm, instead of incremental improvements relative to a business-as-usual baseline.
See the diagram below.